Experimental Incubator/2.1 mamut tamna
On this page you can find more info abot the experimental incubator 2.1 Mamut-Tamna prototype, where Tamna suggests locality where it was build and tested.
This prototype was build based on the blueprints of the 2.1 mamut, with significant help of the Food Hacking Base group who's help was truly appreciated.
Desired features, goals of the prototype
This prototype was aiming to function in a same manner as 2.1 mamut measuring therefore the temperature within the incubator chamber, displaying it on the LCD display, allowing for heating and cooling functions set by button interface running software shared in our Github repository. The power was sourced from a standard computer PSU offering therefore 5 VDC and 12 VDC. For heating the peltier element was used, power estimated to 60 W. The distribution of the heat was carried out by two aluminium heat sinks and thermal paste which were cooled by standard PCU fans, each mounted on the top of the heat sink. The peltier and fans were controlled by Arduino through a circuit composing of darlington transistor multiplying the signal from the Arduino digital pin to switch on/off the mechanical relay providing the power for the fans and peltier (two separated outputs).
The first temporary testing prototype was using a polystyrene box as a chamber, size: a=76cm, b=46 cm and c=46 cm; V= 0.160 816 m3, front of the box covered by think polystyrene insulation and cardboard paper. The heating and cooling unit were attached on the top of the box (in the hole cut and sealed in the polystyrene).
Performance:
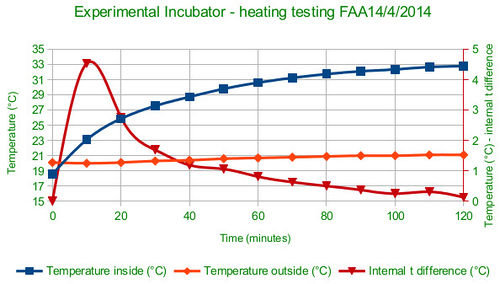
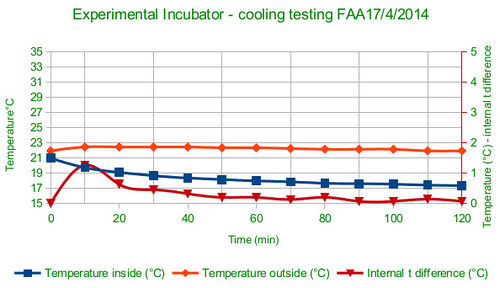
At approximately 20-21°C external temperature, heating the chamber for two hours resulted in 14.25°C increase of temperature from 18.56°C to 32.81°C (12.06°C temperature increase after first hour). Cooling at similar external temperature resulted in 3.62°C temperature decrease after 2 hours, cooling the chamber from 20.93°C to 17.25°C (3°C after temperature decrease after first hour).
I've shared a link to the Google spreadsheet so you can have a look on the values and graphs, I will upload some nice graphs eventually but I'm having a major issue with experting it from Libre Office 3.6.?? to jpg or whatever ...
Heating Experiment 14/4/2014
| Time (min) | Internal temperature (t) (°C) | External t (°C) | Difference of internal t (°C) | Sum of t difference (°C) |
|---|---|---|---|---|
| 0 | 18.56 | 20.10 | 0.00 | 0 |
| 10 | 23.10 | 20.00 | 4.54 | 4.54 |
| 20 | 25.87 | 20.10 | 2.77 | 7.31 |
| 30 | 27.56 | 20.30 | 1.69 | 9.00 |
| 40 | 28.75 | 20.40 | 1.19 | 10.19 |
| 50 | 29.81 | 20.60 | 1.06 | 11.25 |
| 60 | 30.62 | 20.70 | 0.81 | 12.06 |
| 70 | 31.25 | 20.80 | 0.63 | 12.69 |
| 80 | 31.75 | 20.90 | 0.50 | 13.19 |
| 90 | 32.12 | 21.00 | 0.37 | 13.56 |
| 100 | 32.37 | 21.00 | 0.25 | 13.81 |
| 110 | 32.68 | 21.10 | 0.31 | 14.12 |
| 120 | 32.81 | 21.10 | 0.13 | 14.25 |
| 130 | 33.00 | 21.10 | 0.19 | 14.44 |
Legend of Heating Experiment 14/4/2014: Heating program was run to bring up the temperature in the incubator chamber to 42°C, starting at 18.56°C. Within the 120 min of duratin of the test t=32.81°C was reached, therefore total increase of 14.25°C, with 10.19°C increase reached within first 40 minutes. The external temperature was changing minimally and it's therefore considered constant not inteferfering with the experiment. The current set up with 60 W peltier and V= 0.160816 m3 is not suitable for heating over 32°C.
Cooling Experiment 17/4/2014
| Time (min) | Internal temperature (t) (°C) | External t (°C) | Difference of internal t (°C) | Sum of t difference (°C) |
|---|---|---|---|---|
| 0 | 20.93 | 21.9 | 0 | 0 |
| 10 | 19.68 | 22.4 | 1.25 | 1.25 |
| 20 | 19.06 | 22.4 | 0.62 | 1.87 |
| 30 | 18.62 | 22.4 | 0.44 | 2.31 |
| 40 | 18.31 | 22.4 | 0.31 | 2.62 |
| 50 | 18.12 | 22.3 | 0.19 | 2.81 |
| 60 | 17.93 | 22.3 | 0.19 | 3 |
| 70 | 17.81 | 22.2 | 0.12 | 3.12 |
| 80 | 17.62 | 22.1 | 0.19 | 3.31 |
| 90 | 17.56 | 22.1 | 0.06 | 3.37 |
| 100 | 17.5 | 22.1 | 0.06 | 3.43 |
| 110 | 17.37 | 21.9 | 0.13 | 3.56 |
| 120 | 17.31 | 21.9 | 0.06 | 3.62 |
| 130 | 17.25 | 21.8 | 0.06 | 3.68 |

